Twitter polls regularly pull six-figure engagement numbers. A simple “tabs or spaces?” post from a developer account can generate more replies than a carefully crafted blog post. Product teams at companies like Slack and Linear use polls to prioritize features. Teachers use them to check understanding mid-lecture. Event organizers use them to pick dates.
Polls are the simplest form of data collection that exists. One question, a few options, instant results. And yet most people overthink them, underthink them, or confuse them with surveys entirely.
This guide covers how to create a poll that actually gets responses, from choosing the right question format to sharing it with your audience and making sense of the results.
Polls vs surveys: know the difference
People use “poll” and “survey” interchangeably, but they’re different tools for different jobs. Getting this wrong means picking the wrong format and getting worse data.
A poll is a single question with predefined answer choices. It’s fast. Respondents spend five to ten seconds on it. You get a snapshot of opinion or preference across a group.
A survey is a collection of questions, often mixing multiple formats (multiple choice, open-ended, rating scales). Surveys take minutes to complete and produce richer, more nuanced data. If you need that depth, check out our guide to creating surveys from scratch.
Here’s when to use each:
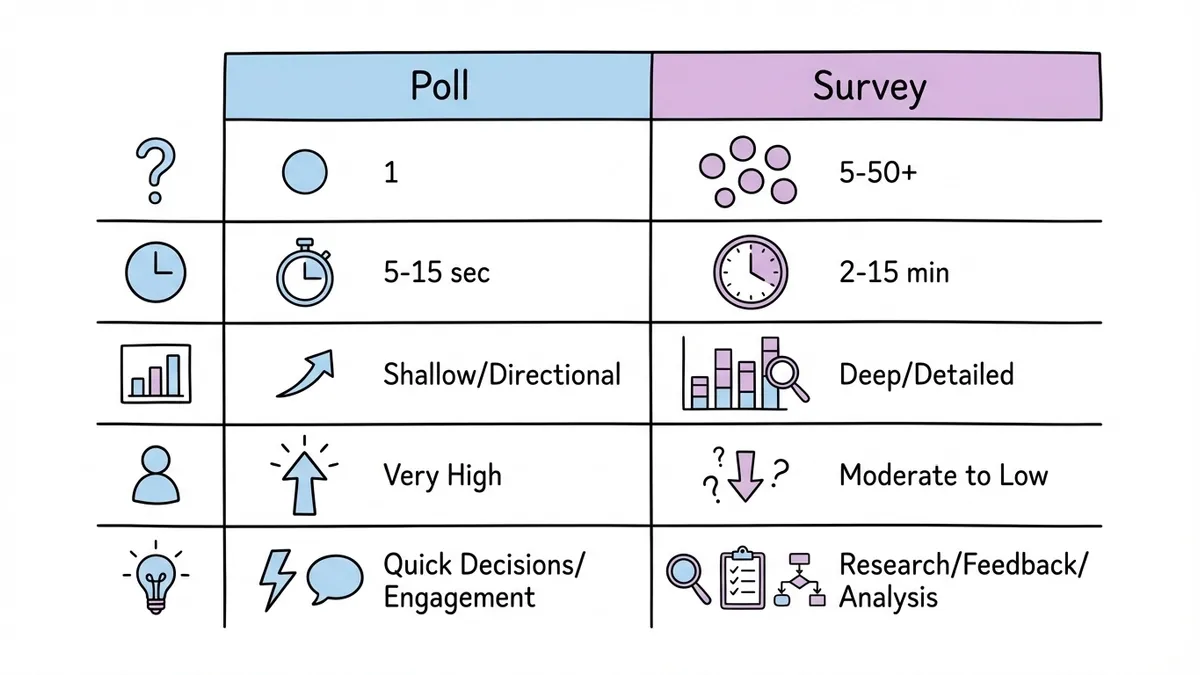
| Poll | Survey | |
|---|---|---|
| Questions | 1 | 5-50+ |
| Time to complete | 5-15 seconds | 2-15 minutes |
| Data depth | Shallow, directional | Deep, detailed |
| Response rate | Very high | Moderate to low |
| Best for | Quick decisions, engagement, temperature checks | Research, feedback, analysis |
The strength of a poll is its simplicity. Don’t try to make it do the work of a survey. If you catch yourself wanting to add “just one more question,” you’re building a survey. That’s fine, but call it what it is and design it accordingly.
When polls are the right tool
Polls shine in specific situations. Using them outside these contexts usually means you’d be better off with a different format.
Quick team decisions. “Should we do the offsite in June or September?” doesn’t need a five-question survey. A poll gets you an answer in an hour.
Audience engagement. Content creators, community managers, and social media teams use polls to spark conversation. The poll itself is the content. The data is secondary.
Gauging interest before committing. Before building a feature, writing a guide, or planning an event, a poll tells you whether anyone cares. It’s a cheap way to validate assumptions.
Voting and elections. From picking a team lunch spot to electing a club president, polls handle straightforward votes cleanly.
Pre-event planning. What topics should the conference cover? Which time slot works best? Polls collect preferences without burdening respondents.
Where polls fall short: anything requiring context, nuance, or follow-up. If you need to understand why people prefer option A over option B, a poll won’t tell you. You’ll need a survey or interviews for that. Similarly, if you’re collecting customer feedback with open-ended responses, a poll isn’t the right format.
Common poll types
Not all polls work the same way. The format you choose affects what kind of data you get back.
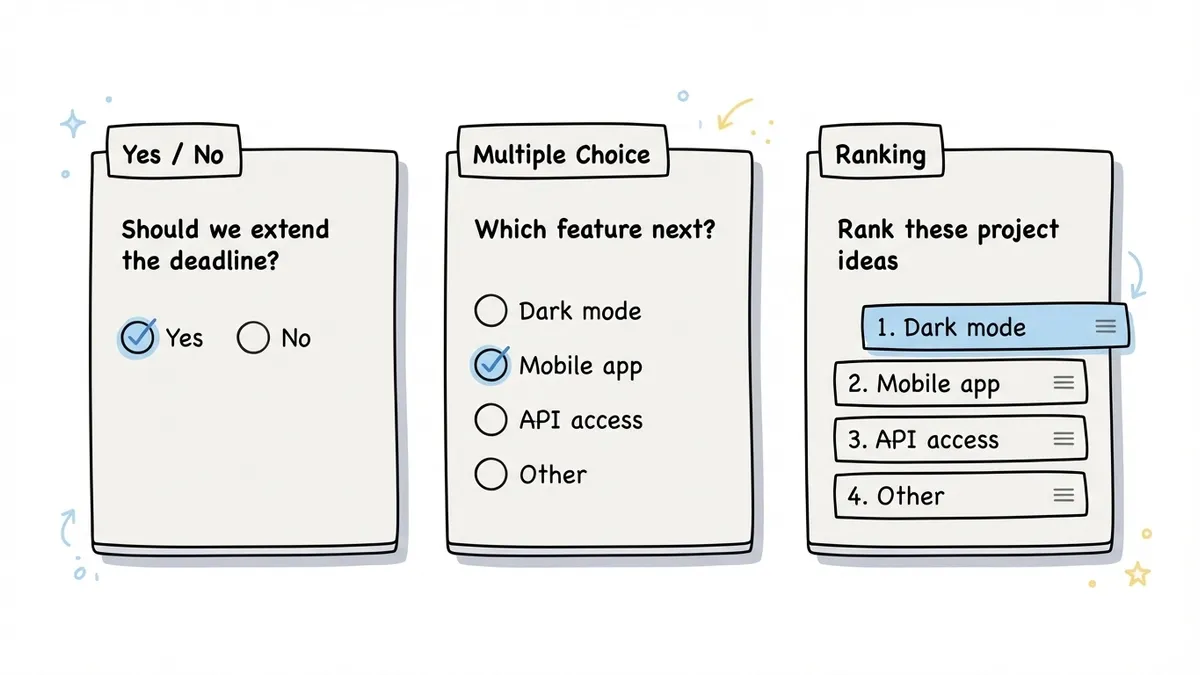
Yes/no polls
The simplest possible poll. Binary choice. “Should we extend the deadline?” “Are you attending the holiday party?” “Do you support this proposal?”
Yes/no polls work when the decision is genuinely binary. They fall apart when the real answer is “it depends” or “maybe, if…” If you suspect people will want a middle ground, add a third option or use a different format.
Multiple choice polls
The workhorse of polling. You provide 3-6 options and respondents pick one. “What should our next blog topic be?” with four specific options. “Which logo do you prefer?” with three designs.
The trick with multiple choice is keeping the options mutually exclusive and collectively exhaustive. If someone’s answer could fit two options, your poll is poorly designed. If their preferred answer isn’t listed at all, you’ll get unreliable data. Adding an “Other” option helps, but if most people pick “Other,” your options missed the mark.
Multiple select polls
Same as multiple choice, but respondents can pick more than one option. “Which of these features do you use regularly? (Select all that apply.)”
These are useful for understanding overlap and breadth of preference, but they’re harder to analyze. If 60% of people selected option A, does that mean it’s the most popular, or just that it was the least controversial? Multiple select data needs more careful interpretation.
Ranking polls
Respondents order the options by preference. “Rank these five project ideas from most to least interesting.”
Ranking polls produce richer data than simple multiple choice because you get relative preference, not just first choice. The downside is they take longer to complete and can feel tedious with more than five or six options. They also don’t work well on mobile if the interface requires dragging items around.
Rating polls
Technically these blur the line between polls and surveys, but a single rating question (“On a scale of 1-10, how likely are you to recommend this product?”) functions like a poll. The NPS survey format is essentially a one-question rating poll with a follow-up.
How to write a good poll question
The question is the entire poll. There’s no second question to clarify, no follow-up to add context. If the question is bad, the data is useless. Here’s what separates good poll questions from bad ones.
Be specific about what you’re asking
“What do you think about our product?” is too vague for a poll. Think about what you’d actually do with the answers. “Which feature should we build next: dark mode, mobile app, or API access?” gives you something actionable.
Vague questions produce vague data. If you can’t imagine making a decision based on the results, the question needs work. If you’re staring at a blank page, our free poll question generator drafts questions with answer options for any topic.
Keep it short
Poll questions should be one sentence. Two at most, if you need a brief setup. If you’re writing a paragraph of context before the question, you’re overcomplicating it. Either simplify the question or accept that you need a survey instead.
Make the options clear and distinct
Each option should be obviously different from the others. “Somewhat agree” and “Slightly agree” are not meaningfully different to most people. “Yes,” “No,” and “Not sure” are clear. “React,” “Vue,” and “Svelte” are clear.
Aim for 3-5 options in most cases. Two feels limiting (unless it’s genuinely binary). More than six and people start skimming instead of reading each option carefully.
Avoid leading the respondent
“Don’t you agree that our new design is better?” isn’t a poll question. It’s a request for validation. Neutral framing matters. “Which design do you prefer: the current version or the updated version?” lets people answer honestly.
This applies to option ordering too. Research from the American Association for Public Opinion Research shows that options listed first tend to get slightly more votes in visual polls. Randomizing option order eliminates this bias if your tool supports it.
Include an escape hatch when appropriate
Sometimes “I don’t know” or “No preference” is the honest answer. Forcing people to pick when they genuinely don’t have an opinion pollutes your data. Not every poll needs this, but consider it for topics where some respondents might lack context.
How to create a poll: step by step
The actual mechanics of building a poll are straightforward. Here’s the process.
Step 1: Define what you need to learn
Write down the specific decision or insight the poll should inform. “I need to know which date works for the most people” or “I want to find out which topic my audience cares about most.” If you can’t state this in one sentence, you’re not ready to write the question yet.
Step 2: Write the question and options
Follow the guidelines above. Draft the question, write out 3-5 options, and then read it from the respondent’s perspective. Would you understand exactly what’s being asked? Would you be able to pick one option without hesitation? If not, revise.
Test it on one or two people before sending it out. You’ll catch ambiguity that you missed because you’re too close to the topic.
Step 3: Pick your tool
You have a lot of options here. Social media platforms have built-in polls (Twitter/X, Instagram Stories, LinkedIn). These are great for engagement but limited in functionality and audience reach.
For a standalone poll you can share anywhere, an online poll maker gives you more control. You can create a poll using a form builder like Fomr by setting up a single-question form with radio buttons or a choice field. It takes about two minutes. The advantage over social media polls is that you own the data, you can customize the design, and you can share it via link, embed, or QR code with anyone, not just your followers on one platform.
Dedicated poll tools like Straw Poll or Poll Everywhere work too, though most lock useful features behind paid plans. For a free poll that looks professional, a form builder with a generous free tier is usually the better bet.
Step 4: Set the rules
Before sharing, decide on a few parameters:
- Deadline. When does voting close? Open-ended polls tend to trickle in forever. Set a clear end date.
- Anonymity. Can you see who voted for what, or is it anonymous? This affects how honestly people respond, especially for sensitive topics.
- Single vs. multiple votes. Can someone vote more than once? For casual polls this might not matter. For anything consequential, one vote per person is important.
Step 5: Share it
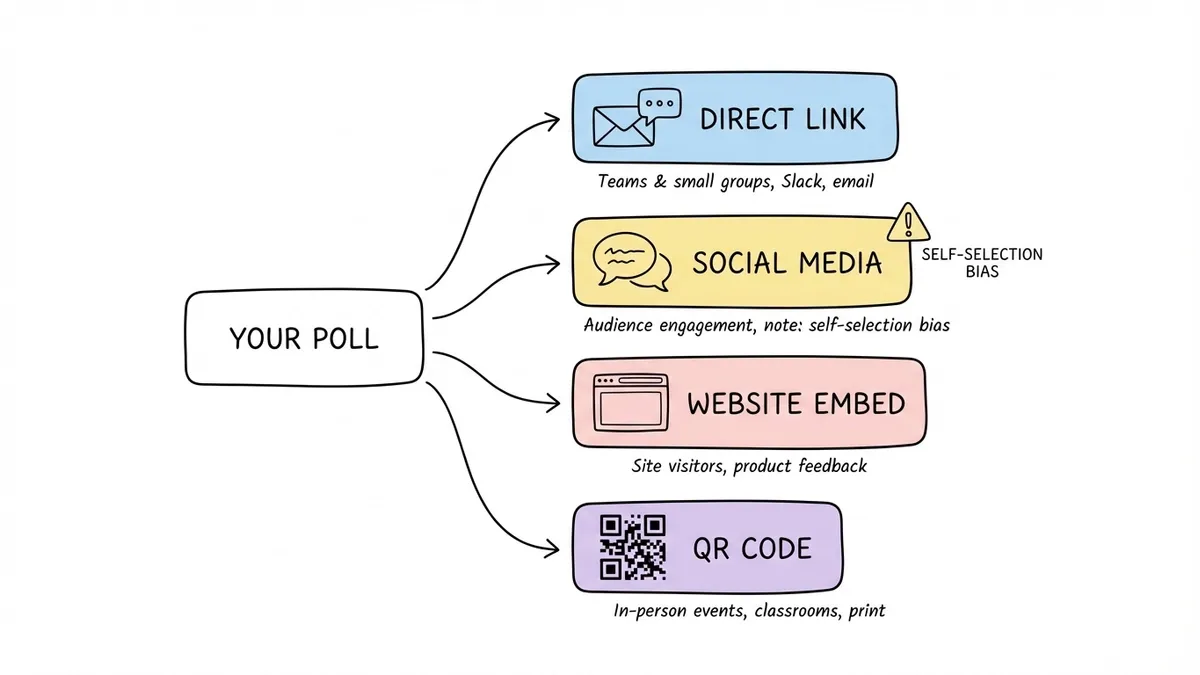
Where you share the poll matters as much as how you write it. A perfectly crafted poll that nobody sees is worthless.
Direct sharing works for teams and small groups. Drop the link in Slack, email it, or text it. For team decisions, this is usually enough.
Social media amplifies reach but introduces self-selection bias. The people who follow you on Twitter aren’t a representative sample of anything except “people who follow you on Twitter.” Keep that in mind when interpreting results.
Website embeds let you poll visitors directly on your site. This is useful for product feedback, content preferences, or any context where the respondent is already engaged with your brand. With Fomr, you can embed a poll on any website using a lightweight JavaScript widget.
QR codes bridge physical and digital. Print the code on a poster, slide deck, or handout, and people scan to vote from their phone. This works well for in-person events, classrooms, and retail environments.
Analyzing poll results
Polls produce simple data, but simple data still needs thoughtful interpretation.
Look at response count, not just percentages
If 80% of respondents picked option A, that sounds decisive. But if only five people voted, that’s four people. Not exactly a mandate. Always report the total number of responses alongside the percentages. For most decisions, you want at least 30-50 responses before treating the results as meaningful.
Watch for selection bias
Who responded matters as much as what they said. If you polled your most engaged community members, their preferences might not reflect your broader audience. If you shared the poll only on one platform, you’re hearing from that platform’s demographic.
This doesn’t mean the data is useless. It means you should be honest about what population the results actually represent.
Consider the margin
If option A got 42% and option B got 38%, that’s not a clear winner. With typical poll sample sizes, that difference could easily be noise. Treat close results as “no strong preference” rather than picking the leader by a hair.
For decisions where the margin matters, you might need a larger sample or a more structured approach. A satisfaction survey or a quiz-style assessment can give you more granular data when a simple poll isn’t enough.
Share the results
People who took the time to vote want to know the outcome. Share the results with your audience, whether that’s a team Slack message, a social media follow-up, or an update on your website. This closes the loop and makes people more likely to participate in future polls.
Mistakes that kill poll response rates
A few common errors tank participation:
Too many options. Seven or more choices cause decision paralysis. People stare at the list, can’t decide, and close the tab. Stick to 3-5 options.
Unclear question. If respondents have to re-read the question to understand it, most won’t bother. They’ll skip it.
No context on why it matters. “Help us decide!” is weak. “We’re picking the topic for next month’s webinar and your vote decides it” gives people a reason to participate.
Burying the poll. If the poll link is at the bottom of a long email or the fourth item in a Slack message, people won’t scroll to it. Lead with the poll.
No deadline. Without urgency, people think “I’ll do it later” and never come back. “Vote by Friday” is simple and effective.
Create your next poll in two minutes
Polls are deceptively simple. One question, a few options, a share link. But the difference between a poll that gets 12 responses and one that gets 200 comes down to the details: a clear question, distinct options, the right distribution channel, and a reason for people to care.
If you want to create a poll for free without signing up for anything, Fomr’s guest editor lets you build and share a poll in about two minutes. Pick a choice field, type your options, customize the look if you want, and grab the share link. No account required.
Whatever tool you use, remember that the question is the product. Spend 80% of your time getting the question right and 20% on everything else. A well-written poll on a basic platform will outperform a poorly written one on the fanciest tool every time.